Automation crucial to increase UK productivity levels.
Blog Post by John Burgess
The UK is lagging behind other countries in its use of industrial robots, and its national productivity is suffering as a result, according to analysis by Balloon One.
Compared to nations with a similar manufacturing output, we are using fewer robots in industry and aren’t able to achieve the same productivity levels.

To gain this insight, we looked at the top countries for robot density (number of industrial robots per 10,000 workers)[1], productivity (GDP per hours worked)[2], and each country’s reliance on manufacturing (value added, percentage of GDP)[3].
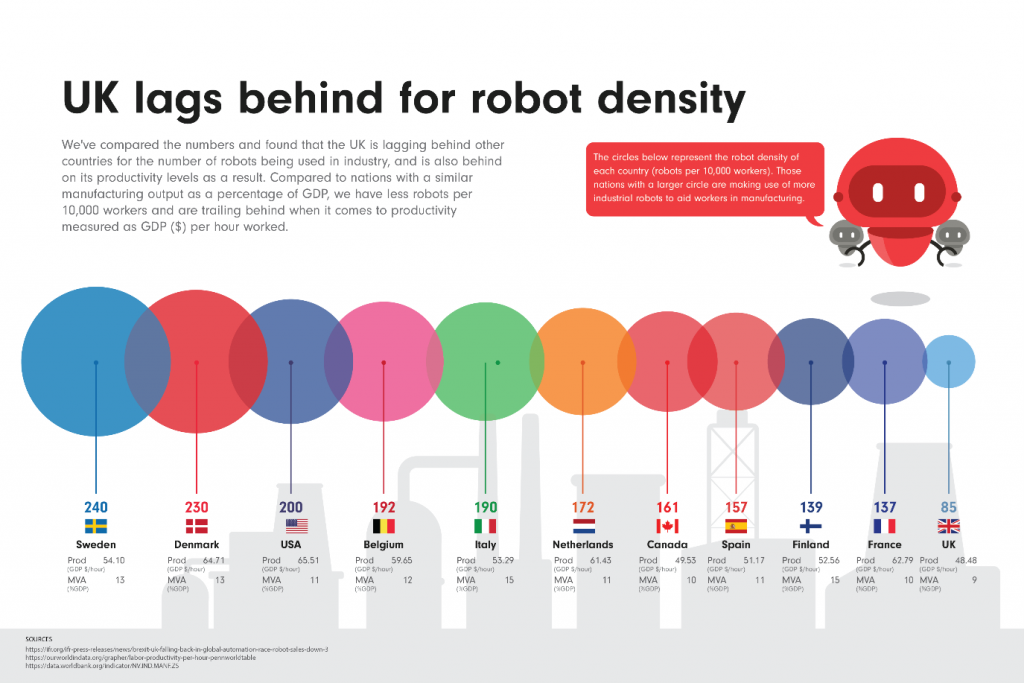
In the graphic below, you can see the UK compared to ten other nations that have similar levels of manufacturing (10–15% of GDP, value added). Not only are we using fewer robots, but we are lagging behind in terms of our productivity levels, arguably as a result of having lower levels of automation.
UK lags behind for robot density.
To see if there really was a link between having a greater robot density and having more productive industry, we looked at data from the nations with the most robots from across the globe to see how productive they were and how much they relied on manufacturing as a percentage of their GDP.
| Country | Robot density 2017 (robots per 10,000 workers) | Productivity in 2017 (GDP $ per hour worked) | Manufacturing, value added (% of GDP) 2017 |
|---|---|---|---|
| Republic of Korea | 710 | 34.06 | 27 |
| Singapore | 658 | 48.25 | 18 |
| Germany | 322 | 66.71 | 21 |
| Japan | 308 | 43.35 | 21 |
| Sweden | 240 | 54.10 | 13 |
| Denmark | 230 | 64.71 | 13 |
| USA | 200 | 65.51 | 11 |
| Belgium | 192 | 59.65 | 12 |
| Italy | 190 | 53.29 | 15 |
| Netherlands | 172 | 61.43 | 11 |
| Austria | 167 | 57.44 | 17 |
| Canada | 161 | 49.53 | 10 |
| Spain | 157 | 51.17 | 11 |
| Slovakia | 151 | 32.73 | 18 |
| Slovenia | 144 | 35.63 | 21 |
| Finland | 139 | 52.56 | 15 |
| France | 137 | 62.79 | 10 |
| Switzerland | 129 | 69.26 | 18 |
| Czech Republic | 119 | 34.76 | 24 |
| China | 97 | 10.68 | 28 |
| UK | 85 | 48.48 | 9 |
The data above shows the top 20 countries for robot density (2017), as well as their productivity in 2017 (GDP $ per hour worked) and manufacturing levels, value added (% of GDP) 2017.
We found that:
- For the countries with a robot density of 200 and above, the average productivity is GDP $53.81 per hour worked and the average manufacturing levels are 71% of GDP.
- For the countries with a robot density between 150–199, the average productivity is GDP $52.17 per hour worked and the average manufacturing levels are 43% of GDP.
- For the countries with a robot density between 85–149, the average productivity is GDP $44.88 per hour worked and the average manufacturing levels are 86% of GDP.
Craig Powell at Balloon said: “This analysis shows that countries with a robot density of 150 or more are, on average, experiencing higher productivity levels than those with a robot density of 149 or less. While it could be argued that this is a result of some nations being more focused on manufacturing as part of their economy, and therefore having developed better infrastructure to meet demand, higher levels of productivity aren’t skewed towards nations that rely more heavily on manufacturing. In fact, manufacturing levels are, on average, higher (17.86% of GDP) in less-robot-dense nations.
“Because there is a correlation between robot density and higher levels of productivity, it seems that if the UK increased its robot density, it could boost productivity. This begs the question of whether the country should invest more in automation if it wants to see a boost in its manufacturing productivity. It certainly seems to be working for nations of a similar standing.”
The map above shows the top 20 countries for robot density (2017), as well as their productivity in 2017 (GDP $ per hour worked) and manufacturing levels, value added (% of GDP) 2017.
Our methodology.
To compare the impact of the UK’s industrial robots, we compared data from the International Federation of Robotics, OECD and the World Bank (see below). We directly compared each data set per country to see if there was a link between robot density and productivity, and whether this was impacted by how dependent on manufacturing each nation is. To find the average figures, we split the nations into three tiers and calculated the average for each data set.
For more insights and updates on the automation and warehousing sector, you can visit Balloon One’s resource centre. Get in touch via the contact form below if you have any queries about this article.
About Balloon One: We are a supply chain technology provider that specialises in warehouse management solutions, enterprise resource planning, transport management systems, and automation for business. We’ve worked with a wide range of customers to help them achieve optimal supply chain performance.
[1] Source: International Federation of Robotics
[2] Source: OECD
[3] Source: The World Bank